
Compare Models
Compare the forecasts of several weather providers and weather models for the same location. When they agree, the forecast is more reliable. When they disagree, you see by how much.
Opening the page
On the main screen, tap the menu button (top right), then Compare models. You can also open it for a saved location from its menu in the favorites drawer.
Choosing what to compare
The page compares one weather value at a time:
- Temperature, feels-like temperature, minimum and maximum temperature
- Precipitation amount, rain, precipitation probability
- Snowfall, snow depth
- Wind speed, wind gusts, wind direction
- Cloud cover, UV index
- Freezing level, rain/snow limit
- Weather icons
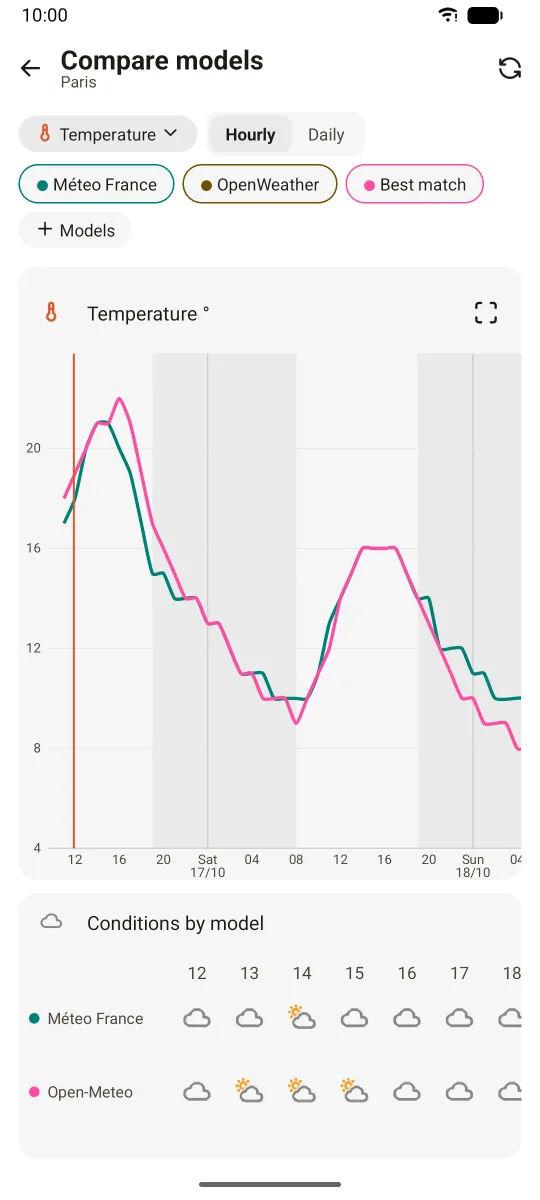
Each value can be compared hourly or daily. It is drawn as a line, bar or dot chart, with one color per model. Weather icons are shown as a grid, one row per model.
Choosing models
You can compare any of the weather providers (Open-Meteo, OpenWeather, Météo-France, AccuWeather) and any of the Open-Meteo models (ECMWF, GFS, ICON, Arome, UK Met Office and many more). By default the page compares Météo-France, OpenWeather and Open-Meteo "Best match". OpenWeather and AccuWeather need an API key.
Modern style
At the top of the page:
- A chip with the compared value. Tap it to choose another.
- An Hourly / Daily switch
- One chip per model, in its chart color. Tap a chip to hide or show that model.
- A + models chip to choose the models
Below the chart:
- A fullscreen button on the chart
- The weather icons of each model
- Spread now: the lowest and highest temperature across the models for the current hour, and the gap between them
Classic style
The models are chosen in a left drawer and the compared value in a right drawer, opened with the two buttons in the top bar.
Settings
Settings > Charts > force charts to show in landscape and charts use full height in portrait also apply to this page.