
Hourly Charts
A full-screen chart of the hourly forecast, plus chart views on the main screen and the daily page.
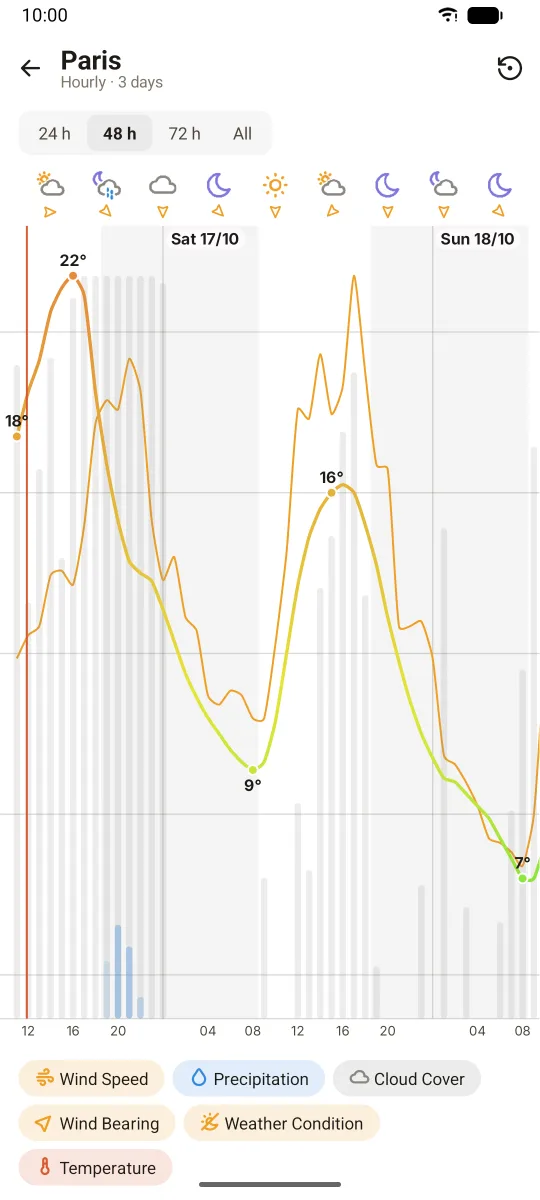
Opening the chart
On the main screen, tap the menu button (top right), then Chart. You can also open it for a saved location from its menu in the favorites drawer.
What the chart shows
- Temperature: a line whose color follows the temperature
- Weather icons along the top
- Wind: wind speed, and arrows for the wind direction
- Precipitation: bars for rain and snow. Paler bars mean a lower probability.
- Cloud cover
Precipitation and cloud cover are shown when they are enabled in Settings > Weather data. If show feels like temperature is on (Settings > Weather data), the temperature line uses the feels-like temperature.
Using the chart
- Pinch to zoom in time, drag to scroll.
- Tap or drag on the chart to see all the values of an hour.
- Legend: tap an item to hide or show that series.
In the modern style:
- Zoom presets at the top: 24 h, 48 h, 72 h and all
- A reset button in the top bar to go back to the selected preset
- The legend is a row of chips under the chart
In the classic style, the legend is in a bottom drawer opened with the list button in the top bar.
The chart covers all the hours of the forecast: 72 by default, set in Settings > Providers.
Hourly views on the main screen
Settings > Hourly > main view hourly display mode changes the hourly row of the main screen:
- Classic: a scrolling row of hours (default)
- Chart: the same chart as above, in a smaller size
- Windy: rows of hourly values, one row per data
Settings > Hourly also sets:
- The weather data shown in the chart and windy views (temperature, icons, wind direction, and any enabled weather data)
- How many hours the main chart covers, and how many are visible at once (6 to 48)
- Alternate background colors
On the daily page, the modern style has tabs to switch between the three views for that day only.
Chart settings
Settings > Charts:
- Force charts to show in landscape
- Charts use full height in portrait
The 12 or 24-hour clock is set in Settings > Language & locales.